Chicago Bears Team Performance Through Data
Each NFL game produces hundreds of individual statistics that can be used to review a team's performance. Rather than just looking at win-loss record, team analytics can help explain why a team succeeds or struggles. This page looks at the Chicago Bears and shows how people can use publicly available NFL statistics to investigate offensive production, defensive performance, turnovers, scoring, and game-by-game trends.
Raw Team Data Factors: Points scored, Points allowed, Passing yards, Rushing yards, Total yards, Turnovers, First downs, Third-down conversions, Red-zone efficiency, Sacks, Interceptions, Game results
The NFL's official statistics can be used to review Chicago's performance in the context of the entire league. Rather than asking whether 6,282 yards is good, one can determine where that number ranks among all the NFL teams. This makes league rankings more useful for finding relative strengths and weaknesses. For example, Chicago's 6,282 total yards ranked highly compared with the rest of the league, while its defensive performance was considerably lower in some areas. Comparing the Bears with other NFL teams allows one to determine whether a statistic represents a genuine team strength or weakness rather than simply looking at the number by itself.

One particularly useful comparison is between Chicago's production and the production of other teams. The Bears actually gained slightly more total yardage than their opponents, but had a dramatic advantage in turnovers. Chicago committed 11 turnovers compared with 33 by its opponents. This suggests that efficiency and ball control may have played a key role in the team's success. Looking at turnover data alongside yardage provides a more complete explanation of the Bears' 11–6 record, more than looking at total yards alone.
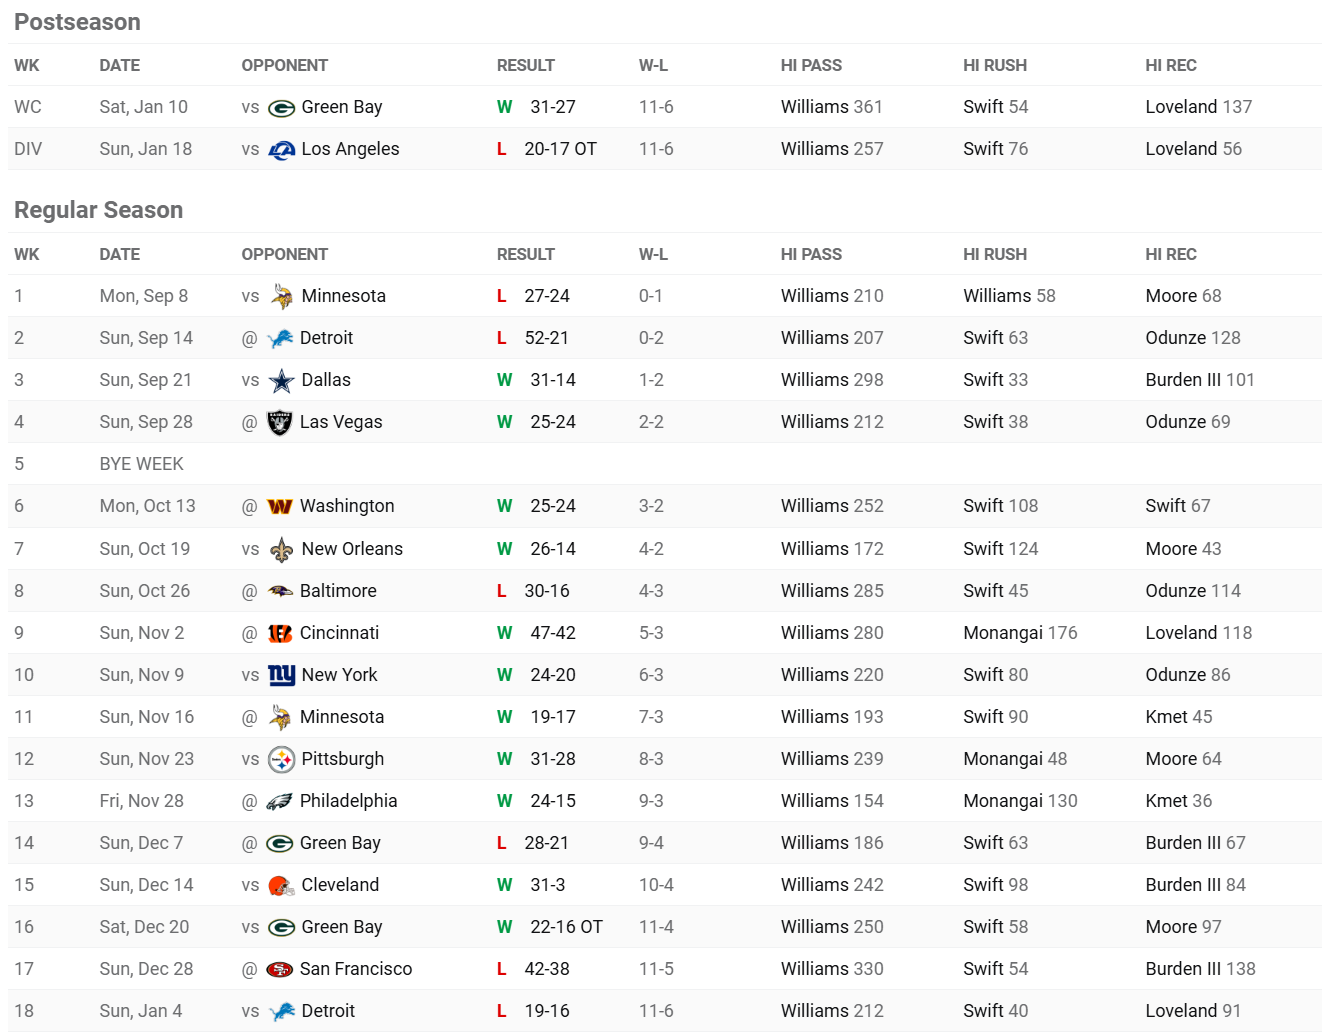
A season average can also hide important differences between individual games. The Bears' game log allows consumers to review indiviual performances and look for larger patterns as well. For example, one could examine whether turnovers, rushing production, or points scored were associated with wins and losses. Comparing several individual games can help determine whether the team's overall season statistics were consistent throughout the year or were influenced by very good or very bad performances.
The relatively small +26 point differential in scoring data suggests that Chicago's 11–6 record was not the result of overwhelming dominance. The Bears won more games than they lost, but their scoring margin could indiciate that many games were relatively competitive. This makes the other statistics especially useful because they can help explain how Chicago was able to consistently win games without a big scoring advantage over its opponents.
Chicago's 2025 season demonstrates why looking at a team's win-loss record, or any one single data point alone can be misleading. The Bears finished 11–6 and won the NFC North, but their stats tell a more detailed story. Their offense ranked highly in total yardage, while their defense ranked much lower in points allowed. At the same time, Chicago committed only 11 turnovers while opponents committed 33. Looking at these stats together suggests that offensive production and especially turnover differential were important contributors to the team's success. A motivated consumer could use these same resources to investigate whether these patterns continued across games and whether particular stats were more strongly associated with Bears wins than others.
Useful Chicago Bears resources:- NFL.com: official NFL team statistics for comparing the Bears to other teams
- Pro Football Reference: detailed Bears team statistics
- Bears Game Log: Useful game-by-game statistics